 ROCK HILL, S.C.– Half of residents in 11 Southern states either agree or strongly agree that America was founded as an explicitly Christian nation, according to the results in the Winthrop Poll Southern Focus Survey.
This viewpoint, a crux of “Christian Nationalism,” is particularly prevalent among white evangelicals. Those who espouse Christian Nationalist beliefs want the United States to be governed as an explicitly Christian nation (for more explanation of Christian Nationalism, see: Whitehead, Andrew L., Samuel L. Perry, and Joseph O. Baker. 2018. “Make America Christian Again: Christian Nationalism and Voting for Donald Trump in the 2016 Presidential Election.” Sociology of Religion 79(2):147-171).
In this latest poll, three-fourths of white evangelical respondents agree or strongly agree with this belief on how the nation was founded. According to poll director, Dr. Scott Huffmon, “Research has shown that increases in Christian Nationalist beliefs lead to more exclusionary views on immigration and more negative views of multi-culturalism in America, those who hold these views care more about whether they have a strong leader who will protect their religious and cultural values than whether a leader is individually pious.”
More than 80% of evangelicals voted for Trump in 2016. The poll found that 80% of Republican (or Republican Leaning) Southerners approve of Trump, while only 4% of Democrats do.
Trump has a 44% approval rating among all respondents and a 48% disapproval rating. This is slightly higher than his national approval ratings. According to Huffmon, “Trump’s approval is still soaring among his base in the South and his overall approval ratings in the region remain slightly higher than his national numbers.”
Meanwhile, Congress has a 70% disapproval rating.
The Southern respondents contacted for this poll reside in: Alabama, Arkansas, Florida, Georgia, Louisiana, Mississippi, North Carolina, South Carolina, Tennessee, Texas and Virginia. The sample size does not allow for breakdowns by individual states.
SEE BELOW FOR QUESTIONS AND RESPONSES
CONFEDERATE MONUMENTS AND FLAG
As some Southern communities and universities ponder what to do with monuments that celebrate Civil War era figures, the Winthrop Poll asked residents what should be done with the statues that commemorate Confederate soldiers who died during the Civil War.
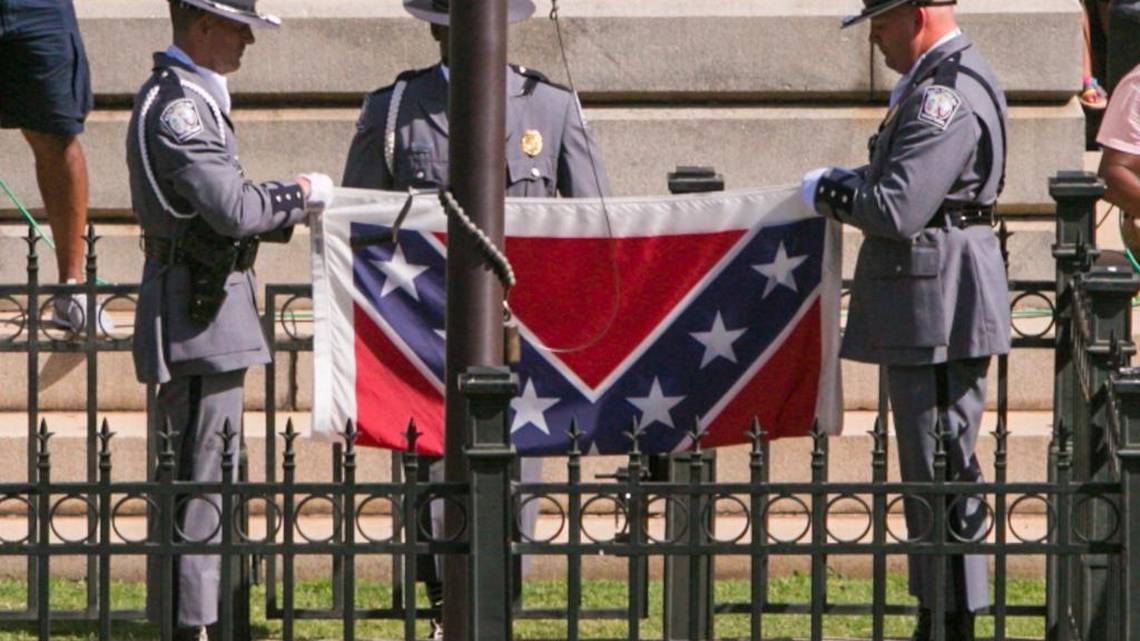
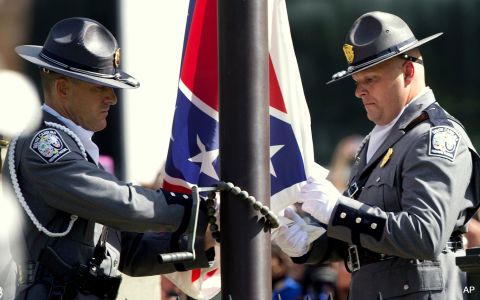
In July 2015, a state Highway Patrol honor guard removed the Confederate flag from the State House grounds. Tim Dominick FILE PHOTOGRAPH
Forty-two percent of Southerners said to leave those memorials alone, while 28% said to add a plaque for context and historical interpretation. Nearly one-fourth want to move the statutes to a museum. Huffmon notes, “All told, 56% want to do something other than simply leave the monuments and statues as they are, but these folks are very divided on what should be done. A strong plurality advocate leaving them as they are.”
As far as statues honoring leaders and politicians who supported racial segregation, 30% said to leave the statues in public spaces. One-fourth said to add a marker, another fourth said to put them in a museum, while 13% said to remove them. Thirty-seven percent of black respondents said to put them in a museum, while a fourth said to remove them.
According to Huffmon, “Statues to avowed segregationists are more controversial than monuments to the confederate fallen. A much slimmer plurality advocate leaving them as is while nearly as many would like to add a marker for historical context or move them to museums. While only 13% wish to remove them entirely, it is notable that this is more than twice as many people who want Confederate memorials wholly removed.”
Concerning the Confederate flag, 46% of Southern residents view it as somewhat or very unfavorable. Only one in five Southerners view it as very favorable. Breaking down the viewpoints by race, there were 44% of whites who view the flag as favorable or very favorable, while 58% of blacks view it as very unfavorable.
This Winthrop Poll sought to find out what Southerners believe the flag stands for. It is viewed by nearly half of all respondents as a symbol of Southern pride. Yet 64% of black respondents view it as a symbol of racial conflict.
CAUSE OF THE CIVIL WAR AND RACE RELATIONS
Even though the American Civil War ended in 1865, the causes of the war continue to be debated. A fourth of all respondents said it was caused by slavery; 21% said states’ rights; and half said both were equal causes. Thirty percent of black respondents said slavery was the cause, while 58% said both slavery and states’ rights were the cause.
It only follows that race and race relations continue to be a controversial subject among Americans. Forty percent of all respondents said race relations are poor in this country, and another 38 percent called them only fair. A majority of black residents – 59% – said relations are poor, while 35% of white residents agreed.

A majority of residents, black and white, said race relations are growing worse.
ECONOMY AND OPPORTUNITY
More than half of Southerners said our country is headed in the wrong direction. This was mostly a Democratic viewpoint because 57% Republicans surveyed said the country is moving on the right track. Still, 77% of Southern residents said our country’s economy as a whole is very good or fairly good and a majority said it is getting better.
The most important problem facing our country, according to those surveyed, is immigration, followed by politicians/government, racism, lack of healthcare and the economy.
Southern Republicans and Democrats are polar opposites in whether all people in the United States have an equal chance to succeed if they work equally hard. Nearly three fourths of Republicans agree while three fourths of Democrats did not agree.
Concerning “political correctness,” more than two thirds of residents agree or strongly agree that it threatens our liberty. Political correctness seems to be much more worrisome to Republicans, as nearly half strongly agreed that it was a threat, while only 14% of Democrats strongly agreed. Overall, however, nearly half of Democrats saw political correctness as a threat to liberty at some level while an overwhelming 84% of Republicans responded that they saw it as a threat at some level.
METHODOLOGY
For this latest Winthrop Poll, callers surveyed 969 residents in 11 Southern states by landline and cell phones between Nov. 10-20 and Nov. 26-Dec. 2. See full methodology statement for a note on the odd array of dates. The Southern states are Alabama, Arkansas, Florida, Georgia, Louisiana, Mississippi, North Carolina, South Carolina, Tennessee, Texas and Virginia. Results which use all respondents have a margin of error of approximately +/- 3.15 at the 95% confidence level. Subgroups have higher margins of error. Margins of error are based on weighted sample size.
–NEW DATA UPDATE–
New data released from December’s Winthrop Poll Southern Focus Survey of 11 southern states show that while attitudes of white and African-American Southerners on racial issues show some congruence, deep divides still exist. New Results begin at Table 17
What the poll uncovers is that whites and blacks have very different experiences living in the South. More than half of African Americans in the region report that they have been discriminated against in the last year because of their race or ethnicity, while 18% of whites report such discrimination.
Nearly identical numbers of whites and blacks in the South, 30% and 28% respectively, feel that America should preserve its “white European heritage.” According to poll director, Professor Scott Huffmon, “We’re not sure what resulted in this common outlook; it could be something as simple as the realization that we sprung from the colonies of a European power. We do know, however, that the phrase “white European heritage” clearly held distinct meaning for some. Nearly half of those who viewed the Confederate Flag favorably agreed with the preservation of white European heritage.”
In two examples of changing attitudes, black and white Southerners generally agreed that people of different races should be allowed to live wherever they please and marry whomever they please, as well as believe that all races should be treated equally.
Differences arose when asking whether whites or racial minorities were “under attack in this country.” Thirty-eight percent of whites and 11% of blacks agreed that whites were under attack while 51% of whites and 89% of blacks agreed that racial minorities were under attack. Among respondents who view the Confederate Flag favorably, 48% agreed that whites are under attack while 42% reported the same for racial minorities. According to Huffmon, “Confederate Flag supporters in the South are notably more likely than others to view whites as the victims in today’s political environment.”
African Americans and whites in the South are nearly mirror images of each other when asked what holds blacks back in today’s society. Over half of African American respondents said that racial discrimination is the main reason blacks can’t get ahead, while over half of whites said that African Americans are responsible for their own condition. Once Again, Confederate Flag supporters showed a stronger trend, with 16% blaming racial discrimination and 72% saying black people who can’t get ahead are responsible for their own condition.
Also released for the first time are the results of a survey based experiment. Half of the respondents were asked whether they believed that whites in America have “privileges” that non-whites do not have, while the other half were asked if they believed that non-whites in America experience “barriers.”
Among those who heard the “privilege” version, 92% of blacks, 50% of whites, and only 36% of Confederate Flag supporters believed whites have privilege. However, among those asked about non-whites facing “barriers,” those agreeing among whites and Confederate Flag supporters increased by about 20 points over the “privilege” wording while slightly fewer African Americans agreed. 
Huffmon noted, “This is a classic ‘framing effect.’ Whether differences are attributed to one group having ‘privilege’ or the other group facing ‘barriers,’ the end result is the same; however, by changing the way we talk about a situation, we see that attitudes can shift. Market researchers have known this for decades. People may recall decades ago the upcharge for paying with a credit card at a gas station came to be called a ‘cash discount’ and suddenly people were much more accepting. Same result, different frame.”
The Southern respondents contacted for this poll reside in: Alabama, Arkansas, Florida, Georgia, Louisiana, Mississippi, North Carolina, South Carolina, Tennessee, Texas and Virginia. The sample size does not allow for breakdowns by individual states.
Previous results in December released dealt with the concept of Christian nationalism, Confederate monuments and the flag, the cause of the Civil War, race relations, the economy and opportunity. New Results begin at Table 17.
METHODOLOGY
For this latest Winthrop Poll, callers surveyed 969 residents in 11 Southern states by landline and cell phones between Nov. 10-20 and Nov. 26-Dec. 2. See full methodology statement for a note on the odd array of dates. The Southern states are Alabama, Arkansas, Florida, Georgia, Louisiana, Mississippi, North Carolina, South Carolina, Tennessee, Texas and Virginia. Results which use all respondents have a margin of error of approximately +/- 3.15 at the 95% confidence level. Subgroups have higher margins of error. Margins of error are based on weighted sample size.
CLICK HERE FOR FULL METHODOLOGY STATEMENT.
POLL FUNDING AND CONTACT INFORMATION
The Winthrop Poll is funded by Winthrop University. For additional information, or to set up an interview with Poll Director Scott Huffmon, please contact Judy Longshaw at longshawj@winthrop.edu or 803-323-2404 (office) or 803-984-0586 (cell).
Poll Demographics for December 2018 Winthrop Poll of the South v. Census Data on the South
(Alabama, Arkansas, Florida, Georgia, Louisiana, Mississippi, North Carolina, South Carolina, Tennessee, Texas and Virginia)
|
Census |
December Winthrop Poll |
|
| 18 to 29 years |
21.5881 |
19.0 |
| 30 to 44 years |
24.1393 |
24.5 |
| 45 to 64 years |
33.8867 |
34.5 |
| 65 years and over |
20.3859 |
22.0 |
|
|
||
| Male |
48.0769 |
48.0 |
| Female |
51.9231 |
52.0 |
| Not Sure |
— |
0.1 |
|
|
|
|
| White alone |
73.7545 |
71.7 |
| Black or African American alone |
20.0113 |
20.1 |
| Other |
6.2342 |
5.9 |
| Refused |
— |
2.3 |
Cell entries represent percent responding as indicated. Columns may not sum to 100 due to rounding
Table 1: Do you approve or disapprove of the way Donald Trump is handling his job as President of the United States?
|
|
All |
GOP (incl Leaners) |
Democrats (incl Leaners) |
National Approval 11/25 (while this poll was in the field) from Gallup |
| Approve |
44 |
80 |
4 |
38 |
| Disapprove |
48 |
13 |
91 |
60 |
| Not Sure |
6 |
6 |
3 |
|
| Refused |
2 |
2 |
1 |
|
Table 2: Do you approve or disapprove of the way Congress is handling its job?
|
|
All |
| Approve |
18 |
| Disapprove |
70 |
| Not Sure |
10 |
| Refused |
3 |
Table 3: Thinking about the current path that our nation is taking, do you think our country is on the right track or headed in the wrong direction?
|
|
All |
GOP (incl Leaners) |
Democrats (incl Leaners) |
| Right Track |
35 |
57 |
9 |
| Wrong Direction |
56 |
33 |
87 |
| Don’t Know/ Refused |
9 |
10 |
4 |
Table 4: What do you think is the most important problem facing the United States of Americatoday?
TOP FIVE
|
|
All |
| Immigration |
13.1 |
| Politicians/
Government |
7.4 |
| Racism |
5.8 |
| Healthcare (people not having it) |
5.5 |
| Economy |
5.2 |
Table 5: How would you rate the condition of the economy of the country as a whole these days? Is it very good, fairly good, fairly bad, or very bad?
|
|
All |
| Very good |
20 |
| Fairly good |
57 |
| Fairly bad |
15 |
| Very bad |
5 |
| Not Sure |
2 |
| Refused |
1 |
Table 6: Right now, do you think that economic conditions in the country as a whole are getting better or getting worse?
|
|
All |
| Getting Better |
56 |
| Getting Worse |
33 |
| Not Sure [volunteered] |
9 |
| Refused |
2 |
Table 7: Which of the following comes closest to your opinion about what to do with monuments or memorials to Confederate soldiers who died during the Civil War?
[CALLER: Randomize options]
Leave them just as they are.
Leave them, but add a plaque or marker for context and historical interpretation
Move them to a museum
Remove them completely
|
|
All |
White |
Black |
| Leave |
42 |
47 |
26 |
| Leave BUT add marker |
28 |
31 |
16 |
| Museum |
23 |
17 |
42 |
| Remove |
5 |
3 |
13 |
| Not sure/ Don’t know |
2 |
1 |
3 |
| Refused |
1 |
0 |
1 |
Table 8: Which of the following comes closest to your opinion about what to do with statues honoring leaders and politicians who SUPPORTED racial segregation?
[CALLER: Randomize options]
Leave them just as they are.
Leave them, but add a plaque or marker for context and historical interpretation
Move them to a museum
Remove them completely
|
|
All |
White |
Black |
| Leave |
30 |
34 |
18 |
| Leave BUT add marker |
26 |
30 |
16 |
| Museum |
26 |
23 |
37 |
| Remove |
13 |
10 |
25 |
| Not Sure/ Don’t Know |
2 |
2 |
2 |
| Refused |
2 |
2 |
3 |
Table 9: Is your view of the Confederate Flag favorable or unfavorable?
Would you say that is Very or Somewhat?
[CALLER: if someone asks “Which Confederate flag,” Respond: “The one commonly referred to as the Confederate Battle Flag.”]
|
|
All |
White |
Black |
| Very Favorable |
20 |
24 |
8 |
| Somewhat Favorable |
17 |
20 |
7 |
| Somewhat Unfavorable |
18 |
18 |
15 |
| Very Unfavorable |
28 |
20 |
58 |
| Not Sure/ Don’t Know |
14 |
15 |
11 |
| Refused |
4 |
4 |
2 |
Table 10: Do you think the Confederate flag is more a symbol of racial conflict or of Southern pride?
|
|
All |
White |
Black |
| Racial Conflict
|
38 |
31 |
64 |
| Southern Pride
|
47 |
55 |
21 |
| Don’t Know
|
12 |
11 |
13 |
| Refused |
3 |
3
|
2 |
Table 11: What’s your impression of the main cause of the Civil War? Was the Civil War mainly about slavery, mainly about states’ rights, or about both equally?
|
|
All |
White |
Black |
| Slavery |
25 |
23 |
30 |
| States’ Rights |
21 |
26 |
8 |
| Both Equally |
49 |
46 |
58 |
| Not Sure/ Don’t Know |
4 |
5 |
3 |
| Refused |
1 |
1 |
1 |
Table 12: Now, we’re going to talk about matters of race and race relations for a bit.
How would you rate race relations in the UNITED STATES today? Excellent, Good, Only Fair, or Poor
|
|
All |
White |
Black |
| Excellent |
2 |
2 |
1 |
| Good |
18 |
21 |
8 |
| Only Fair |
38 |
41 |
32 |
| Poor |
41 |
35 |
59 |
| Don’t Know/ Not sure |
1 |
1 |
0 |
| Refused |
1 |
1 |
1 |
Table 13: Do you feel race relations in the UNITED STATES are getting better or getting worse?
|
|
All |
White |
Black |
| Better
|
31 |
36 |
15 |
| Worse
|
61 |
56 |
76 |
| Not changing// staying same [volunteered]
|
6 |
6 |
5 |
| Refused
|
3 |
3 |
3 |
Table 14: ‘Political correctness’ threatens our liberty as Americans to speak our minds.
|
|
All |
GOP (incl Leaners) |
Democrats (incl Leaners) |
| Strongly Agree
|
31 |
47 |
14 |
| Agree
|
37 |
37 |
35 |
| Neither agree nor disagree
|
5 |
2 |
7 |
| Disagree
|
17 |
10 |
29 |
| Strongly disagree
|
7 |
2 |
11 |
| Don’t Know/ Refused
|
3 |
2 |
3 |
Table 15: America was founded as an explicitly Christian nation.
|
|
All |
GOP (incl Leaners) |
Democrats (incl Leaners) |
White Evangelicals |
| Strongly Agree
|
18 |
29 |
9 |
34 |
| Agree
|
33 |
38 |
29 |
42 |
| Neither agree nor disagree
|
8 |
7 |
6 |
4 |
| Disagree
|
21 |
18 |
24 |
14 |
| Strongly disagree
|
16 |
5 |
28 |
5 |
| Don’t Know/ Refused
|
4 |
3 |
4 |
1 |
Table 16: Do you believe all people in the United States do or do not have an equal chance to succeed if they work equally hard?
|
|
All |
GOP (incl Leaners) |
Democrats (incl Leaners) |
| Do
|
49 |
72 |
22 |
| Do NOT
|
47 |
25 |
74 |
| Not Sure [volunteered]
|
3 |
2 |
4 |
| Refused
|
1 |
0 |
— |
Table 17: In the past year, do you feel that you have been discriminated against because of your race or ethnicity?
|
|
All |
White |
Black |
| Yes |
27 |
18 |
52 |
| No |
72 |
80 |
46 |
| Not Sure |
1 |
1 |
2 |
| Refused |
0 |
0 |
— |
NOTE: The Question seen in Table 18 was ONLY asked of those who reported that they have experienced racial discrimination in the last year.
Table 18: How often would you say you have been discriminated against in the last year because of your race or ethnicity? Frequently, Occasionally, or Rarely?
|
|
All (27% of all resp) |
White (18% of whites) |
Black 52% of blacks) |
| Frequently |
19 |
19 |
15 |
| Occasionally |
43 |
36 |
51 |
| Rarely |
38 |
45 |
33 |
| Don’t Know/Refused |
1 |
— |
1 |
NOTE: For the tables below “View Confederate Flag Favorably” means those who responded that their view of the Confederate Flag was “Very Favorable” or “Somewhat Favorable”
Table 19: America must protect and preserve its White European heritage.
[CALLER: Prompt as necessary, “Would you say that you Strongly Agree, Agree, Neither Agree nor Disagree, Disagree, or Strongly Disagree with that statement?”]
|
|
All |
White |
Black |
View Confederate Flag Favorably |
| Strongly Agree |
8 |
9 |
6 |
15 |
| Agree |
21 |
21 |
22 |
32 |
| Neither agree nor disagree |
12 |
13 |
8 |
11 |
| Disagree |
25 |
25 |
25 |
24 |
| Strongly disagree |
29 |
28 |
33 |
14 |
| Don’t Know/ Refused |
5 |
4 |
7 |
5 |
Table 20: Marriage should only be allowed between people of the same race.
[CALLER: Prompt as necessary, “Would you say that you Strongly Agree, Agree, Neither Agree nor Disagree, Disagree, or Strongly Disagree with that statement?”]
|
|
All |
White |
Black |
View Confederate Flag Favorably |
| Strongly Agree |
3 |
4 |
3 |
6 |
| Agree |
4 |
4 |
5 |
6 |
| Neither agree nor disagree |
4 |
4 |
3 |
7 |
| Disagree |
28 |
27 |
32 |
35 |
| Strongly disagree |
60 |
60 |
58 |
44 |
| Don’t Know/ Refused |
1 |
2 |
— |
1 |
Table 21: People of different races should be free to live wherever they choose
[CALLER: Prompt as necessary, “Would you say that you Strongly Agree, Agree, Neither Agree nor Disagree, Disagree, or Strongly Disagree with that statement?”]
|
|
All |
White |
Black |
View Confederate Flag Favorably |
| Strongly Agree |
67 |
68 |
64 |
55 |
| Agree |
28 |
26 |
32 |
37 |
| Neither agree nor disagree |
1 |
1 |
1 |
2 |
| Disagree |
2 |
2 |
1 |
3 |
| Strongly disagree |
1 |
1 |
1 |
1 |
| Don’t Know/ Refused |
2 |
1 |
2 |
1 |
Table 22: White people are currently under attack in this country
[CALLER: Prompt as necessary, “Would you say that you Strongly Agree, Agree, Neither Agree nor Disagree, Disagree, or Strongly Disagree with that statement?”]
|
|
All |
White |
Black |
View Confederate Flag Favorably |
| Strongly Agree |
8 |
10 |
1 |
14 |
| Agree |
23 |
28 |
10 |
34 |
| Neither agree nor disagree |
10 |
11 |
6 |
9 |
| Disagree |
29 |
26 |
37 |
27 |
| Strongly disagree |
29 |
24 |
45 |
14 |
| Don’t Know/ Refused |
1 |
1 |
2 |
1 |
Table 23: All races should be treated equally.
[CALLER: Prompt as necessary, “Would you say that you Strongly Agree, Agree, Neither Agree nor Disagree, Disagree, or Strongly Disagree with that statement?”]
|
|
All |
White |
Black |
View Confederate Flag Favorably |
| Strongly Agree |
74 |
75 |
72 |
64 |
| Agree |
25 |
24 |
27 |
35 |
| Neither agree nor disagree |
0 |
0 |
— |
0 |
| Disagree |
0 |
1 |
— |
0 |
| Strongly disagree |
0 |
— |
1 |
— |
| Don’t Know/ Refused |
0 |
0 |
— |
1 |
Note: Every category with a zero had respondents, but since each was below 0.5, they were rounded to zero
Table 24: Racial minorities are currently under attack in this country.
[CALLER: Prompt as necessary, “Would you say that you Strongly Agree, Agree, Neither Agree nor Disagree, Disagree, or Strongly Disagree with that statement?”]
|
|
All |
White |
Black |
View Confederate Flag Favorably |
| Strongly Agree |
23 |
17 |
45 |
10 |
| Agree |
36 |
34 |
44 |
32 |
| Neither agree nor disagree |
6 |
7 |
2 |
6 |
| Disagree |
23 |
28 |
6 |
32 |
| Strongly disagree |
10 |
12 |
2 |
17 |
| Don’t Know/ Refused |
3 |
3 |
2 |
3 |
Table 25: Do you feel that generations of slavery and discrimination do or do not make it difficult for Blacks to work their way out of the lower class?
Do you feel that way Strongly or Somewhat?
|
|
All |
White |
Black |
View Confederate Flag Favorably |
| Strongly DO make it difficult |
28 |
20 |
53 |
12 |
| Somewhat DO make it difficult |
25 |
27 |
22 |
22 |
| Somewhat do NOT make it difficult |
12 |
14 |
11 |
14 |
| Strongly do NOT make it difficult |
28 |
33 |
10 |
50 |
| Don’t Know/ Not Sure |
4 |
5 |
2 |
2 |
| Refused |
2 |
1 |
3 |
1 |
Table 26: Which of the following statements comes closest to your view?
[CALLER: Rotate answers]
Racial discrimination is the main reason why many black people can’t get ahead these days
OR
Black people who can’t get ahead in this country are mostly responsible for their own condition
|
|
All |
White |
Black |
View Confederate Flag Favorably |
| Racial Discrimination |
33 |
29 |
53 |
16 |
| Responsible own condition |
47 |
51 |
32 |
72 |
| Don’t Know/ Not Sure |
13 |
13 |
12 |
6 |
| Refused
|
7 |
7 |
3 |
5 |
Table 27: Which of the following statements comes closest to your view?
[CALLER: Rotate answers]
Our country has made the changes needed to give blacks equal rights with whites
OR
Our country needs to continue making changes to give blacks equal rights with whites
|
|
All |
White |
Black |
View Confederate Flag Favorably |
| Has Made Changes |
41 |
50 |
9 |
61 |
| Needs to Continue |
54 |
44 |
89 |
34 |
| Don’t Know/ Not Sure |
3 |
3 |
1 |
2 |
| Refused
|
3 |
3 |
1 |
2 |
NOTE: Tables 28 & 29 represent a survey based experiment. Half of the respondents were randomly selected to hear the version seen in Table 28 while the other half saw the version seen in Table 29
Table 28: Do you believe whites in America experience privileges that non-whites do not experience?
[CALLER: If they ask what kind of privileges, respond, “Just an easier time with some things, in general”]
Do you feel that way Strongly or Somewhat
|
|
All |
White |
Black |
View Confederate Flag Favorably |
| Strongly have privilege |
35 |
23 |
71 |
15 |
| Somewhat have privileges |
25 |
27 |
21 |
21 |
| Somewhat do NOT have privilege |
11 |
14 |
3 |
16 |
| Strongly do NOT have privilege |
25 |
32 |
4 |
46 |
| Don’t Know/ Not Sure |
3 |
3 |
1 |
2 |
| Refused |
1 |
1 |
— |
1 |
Table 29: Do you believe non-whites in America experience barriers that whites do not experience?
[CALLER: If they ask what kind of barriers, respond, “Just a harder time with some things, in general”]
Do you feel that way Strongly or Somewhat
|
|
All |
White |
Black |
View Confederate Flag Favorably |
| Strongly have barriers |
41 |
36 |
65 |
20 |
| Somewhat have barriers |
31 |
35 |
20 |
35 |
| Somewhat do NOT have barriers |
8 |
8 |
10 |
12 |
| Strongly do NOT have barriers |
14 |
17 |
4 |
30 |
| Don’t Know/ Not Sure |
4 |
4 |
1 |
3 |
| Refused |
1 |
1 |
— |
1 |
Table 30: Framing effects of question wording: Belief that ‘Whites have Privilege’ or ‘Non-whites Face Barriers’ (strongly & somewhat combined) by Race and Favorable View of the Confederate Flag (strongly & somewhat combined)
|
Question Wording / Version |
||
|
Whites have Privilege |
Non-whites face Barriers |
|
| Whites |
50 |
71 |
| Blacks |
92 |
85 |
| Those Who View Confederate Flag Favorably |
36 |
55 |
For methodological questions please read the full Methodology Statement
Contact Information:
Judy Longshaw
803/323-2402 (office)
803/984-0586 (cell)
The Winthrop Poll is paid for by Winthrop University.
For additional information, or to set up an interview with Dr. Scott Huffmon, please contact Judy Longshaw at longshawj@winthrop.edu or 803/323-2404.
Note: Winthrop University, located in Rock Hill, S.C., is a nationally recognized public university offering graduate and undergraduate degrees to an inclusive, international student body.